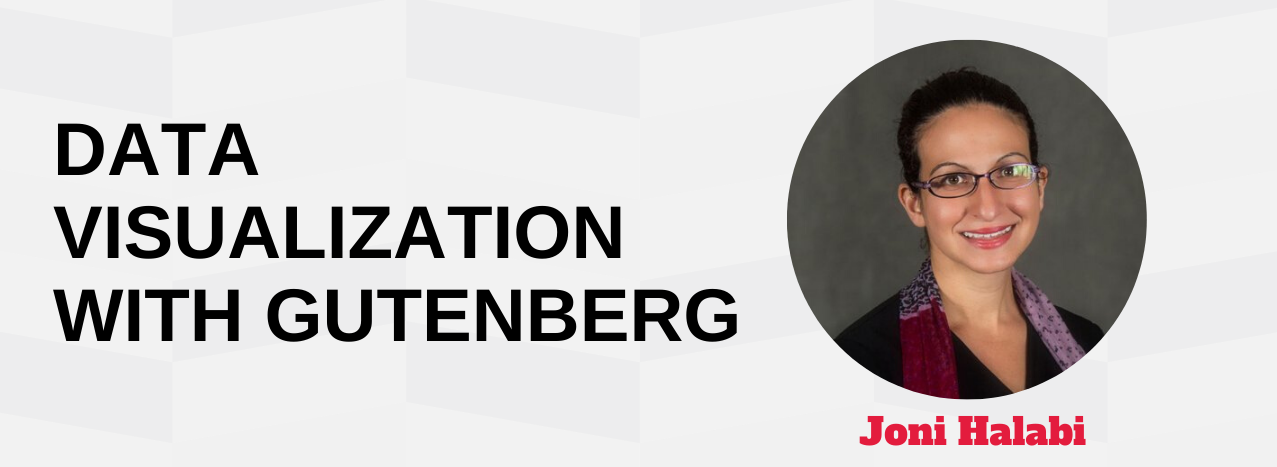
Data Visualization with Gutenberg with Joni Halabi
Data visualizations are graphical representations of large and small datasets. Usually, they are charts or graphs that make patterns in these datasets easier to understand.
This developer-focused presentation will show how to create a custom data visualization content block. The first part of the presentation will be a quick overview about how to create a custom block. We will then discuss how to import data from a Google Sheet using the Google API.
The second part of this presentation will demonstrate how to use that data to create a chart with SVG. Finally, we will discuss best practices around how to make these SVG charts responsive and accessible.


